
I never got the hang of UML: overly complicated, hard to understand, too close to code. Hence, I was skeptical about C4 diagrams when I first heard about them. When I saw Simon Brown using them in his talk Modular Monoliths, I immediately knew: C4 diagrams are the simple and flexible notation I have always wanted. And here I am using them for visualising Qt embedded systems.
The C4 Model
Simon Brown created the C4 model for visualising software architecture. The C4 model looks at software on four abstraction levels.
- Context: An embedded system is part of a larger ecosystem: the system context. The Context diagram describes the interactions between the embedded system and other systems like users, machines, cloud services and operating conditions.
- Containers: An embedded system consists of one or more executable units: the containers. The containers of an infotainment system are the radio, media, phone and navigation applications and their services. The Container diagram shows the responsibilities of the executable units, their interactions and the technological choices for the interactions. Note: These containers have nothing to do with Docker containers.
- Components: Containers are decomposed into modules or components. The Component diagram shows the responsibilities of the components and their interactions. It also shows which technology (e.g., QML, Qt, Boost, Protobuf or C++) is used to implement a component.
- Code: Code diagrams should be generated automatically. I use them rarely, because expressive unit tests from TDD are typically more illuminating than code diagrams. A good use could be the visualisation of influential functional requirements that shape an architecture.
Simon Brown suggests a simple notation for these diagrams “that works well on whiteboards, paper, sticky notes, index cards and a variety of diagramming tools”. The brilliant thing about the notation is that we can use it on all four abstraction levels. There is no need to use different notations on different levels.

The top row shows the elements on the context level: Persons and Software Systems. Each element has a name, a type and an optional description. <Person Name> and <System Name N> are placeholders for names and <Description> for descriptions. The relationships between elements are shown as dashed arrows. Each relationship is labelled with a description and a technology.
The middle row shows the elements on container level and the bottom row on component level. Except for the type and for the background colour, Containers, Components and their relationships look the same as Software Systems.
Let us apply the C4 model to the diagrams in my posts about architecture and visualise a harvester terminal on context, container, component and code level. I’ll look at the upper two Cs – Level 1: Context and Level 2: Containers – in this post and come back to the lower two Cs in a later post.
So far, I have drawn my architecture diagrams with PowerPoint. This is OK for talks and posts. It becomes cumbersome for real-life projects, where the diagrams change frequently and where several people work on the same diagrams. So, I decided to take Structurizr for a spin. Structurizr is a text-based modelling tool for specifying C4 diagrams as code. Simon Brown, the creator of the C4 notation, develops Structurizr.
In the section Drawing Diagrams with Structurizr, I show how to code the diagrams from the section Level 1: Context and Level 2: Containers with Structurizr Lite, the free version of Structurizr. The diagram code can be found in the directory docs/architecture/intro-c4-diagrams of the git repository eu-terminal-apps.
Level 1: Context

The Context diagram shows how the Harvester Terminal cooperates with other Software Systems (Harvester ECUs, Harvester Cameras, IoT Cloud), Persons (Driver) and Constraints (Operating Conditions). The Harvester Terminal is the system of interest and hence shown in red.
- The Driver assesses the situation by looking at the display of the Harvester Terminal, at the Camera displays and out of the cabin’s windows. He acts on the gathered information, for example, by slowing down the harvester to leave fewer roots on the field, by increasing the turbine speed to clean the roots better or by cutting the leaves higher to avoid cutting into the roots. The Driver interacts with the Terminal via multi-touch, two rotary knobs and several hard buttons.
- The Harvester ECUs send parameter values to the Terminal so that the Driver can act properly. They receive parameter values from the Terminal, for example, to reduce the engine speed, to increase the turbine speed, or to lift the knives for cutting the leaves. The Terminal and the Harvester ECUs communicate over 2 CAN busses using the J1939 protocol. ECUs control the engine, steering, drive, header, bunker, conveyor belts, AC, radio, joystick, rotary knobs, hard buttons and other harvester parts.
- Harvester Cameras stream video over an Ethernet link to the Harvester Terminal. A sugar-beet harvester may have a 270-degree rear-view camera, a turbine camera and a shovel camera. Currently, the Driver must decide whether there is an obstacle behind or beside the harvester, whether the turbine cleans the dirt from the roots well enough and whether the shovels must dig deeper. In the future, the cameras may use image recognition to automate these tasks.
- The Harvester Terminal logs harvester data to the IoT Cloud using the MQTT protocol over an LTE-M link. The IoT Cloud logs data for fleet management and accounting. It also coordinates OTA updates of the Terminal, the Harvester ECUs and the Harvester Cameras. Using MQTT over LTE-M constitutes an architectural decision best documented in an Architectural Decision Record.
- Operating Conditions like light, temperature, water, dust and vibration constrain the Terminal’s hardware and software. The vibration of a 1000-horse-power harvester renders combo boxes, menus and sliders nearly unusable. Working on the field at day and night makes a bright and adjustable display a must. I extended the C4 notation by a Constraint element (the dark grey circle) for the Operating Conditions. Such a Constraint element is crucial to embedded systems.
So far, we looked at the Context diagram only from the technical perspective. We should also look at it from the social perspective: how to structure the teams that develop the Terminal, Harvester ECUs, Harvester Cameras and IoT Cloud. The link between the two perspectives is Conway’s law: The system architecture reflects the organisation’s structure. A messed-up organisation structure rarely rarely results in a good, right and successful architecture.
The predecessor of the terminal, which I built for the ROPA sugar beet harvesters, was built by a single team. The Terminal and the ECUs were tightly coupled. It was impossible to replace the Terminal with another one, because the communication between Terminal and ECUs relied on internals from the other side. This is a clear case of supplier lock-in.
When developing the new terminal, we had three teams: one for the Terminal (including the Cameras), one for the Harvester ECUs and one for IoT Cloud. The result was a loosely coupled architecture of systems communicating through clearly defined interfaces. The Terminal used the Harvester ECUs and the IoT Cloud as services. While defining the interfaces, the collaboration between the respective two teams was high. Once defined, there was little communication needed. Each of the three teams was run as a feature team.
The Terminal team took care of the Harvester Cameras, as they just streamed video. If the cameras took decisions based on image recognition, we would have needed a separate complicated-subsystem team. The Terminal team would not have had the expertise to do that. Matthew Skelton and Manuel Pais explain in their book Team Topologies how to structure teams based on the architecture (see also my review).
Without doubt, the Context diagram is much more expressive than my makeshift diagram from Architecture of Qt Embedded Systems: Getting Started.

Level 2: Containers
The Container diagram focuses on the system of interest from the Context diagram. It shows the runnable units – applications with or without GUI – that make up the Terminal system and how they interact. In my post Architecture of Qt Embedded Systems: Single vs. Multiple GUI Applications, I describe how a system with a single GUI application evolves into a system with multiple GUI applications – driven by architecturally significant requirements (ASRs). This section provides the Container diagrams for this evolution.
When I built my first harvester terminal in 2012, the Terminal system consisted of a single GUI application. The system didn’t need a separate window manager, as the single GUI application rendered itself to the single window using Qt’s eglfs platform. In 2022, Terminal system routinely have a window manager, even if it controls only a single application. The Terminal system is decomposed into the Window & App Manager and the Terminal App.

Once the harvesters had a telematics unit with a 3G or LTE-M modem on board, the harvester OEMs had three more ASRs:
- They wanted remote support. Their support engineers should be able to see the display contents of each harvesters from their offices. A simple solution is to run a VNC server on the Terminal system. The VNC server sends the frame buffer contents to an office computer with a VNC client anywhere in the world.
- They wanted to update the application, the Qt libraries and possibly the whole Linux system over the air (OTA). The Terminal Application can update itself. However, it’s a lot easier if a second GUI application – the Update Application – performs the update. Especially for system updates, the Update Application may be executed by a Linux system running from a RAM disk.
- They wanted to log relevant machine data into the IoT Cloud, say, for fleet management and accounting. The Terminal needs an IoT Client that forwards the data from the Terminal System and the Harvester ECUs to the IoT Cloud. The IoT Client may be supplied by the IoT Cloud provider or developed by another team. Therefore, it is deployed as a separate non-GUI application.
Integrating a VNC server for remote support and an Update Application into the Terminal system makes a Window & App Manager nearly inevitable. Wayland-based compositors like Weston and the QML compositor have become the standard choice over the last 5-10 years.
Both the Terminal Application and the IoT Client read messages from the CAN busses. As soon as one application has received a message, the other won’t see it any more. Having two applications sending the same message with different parameter values needs some coordination as well. We must move the responsibility for receiving and sending CAN messages from the Terminal Application, the IoT Client and possibly other applications into the J1939 Service, a non-GUI application or service.
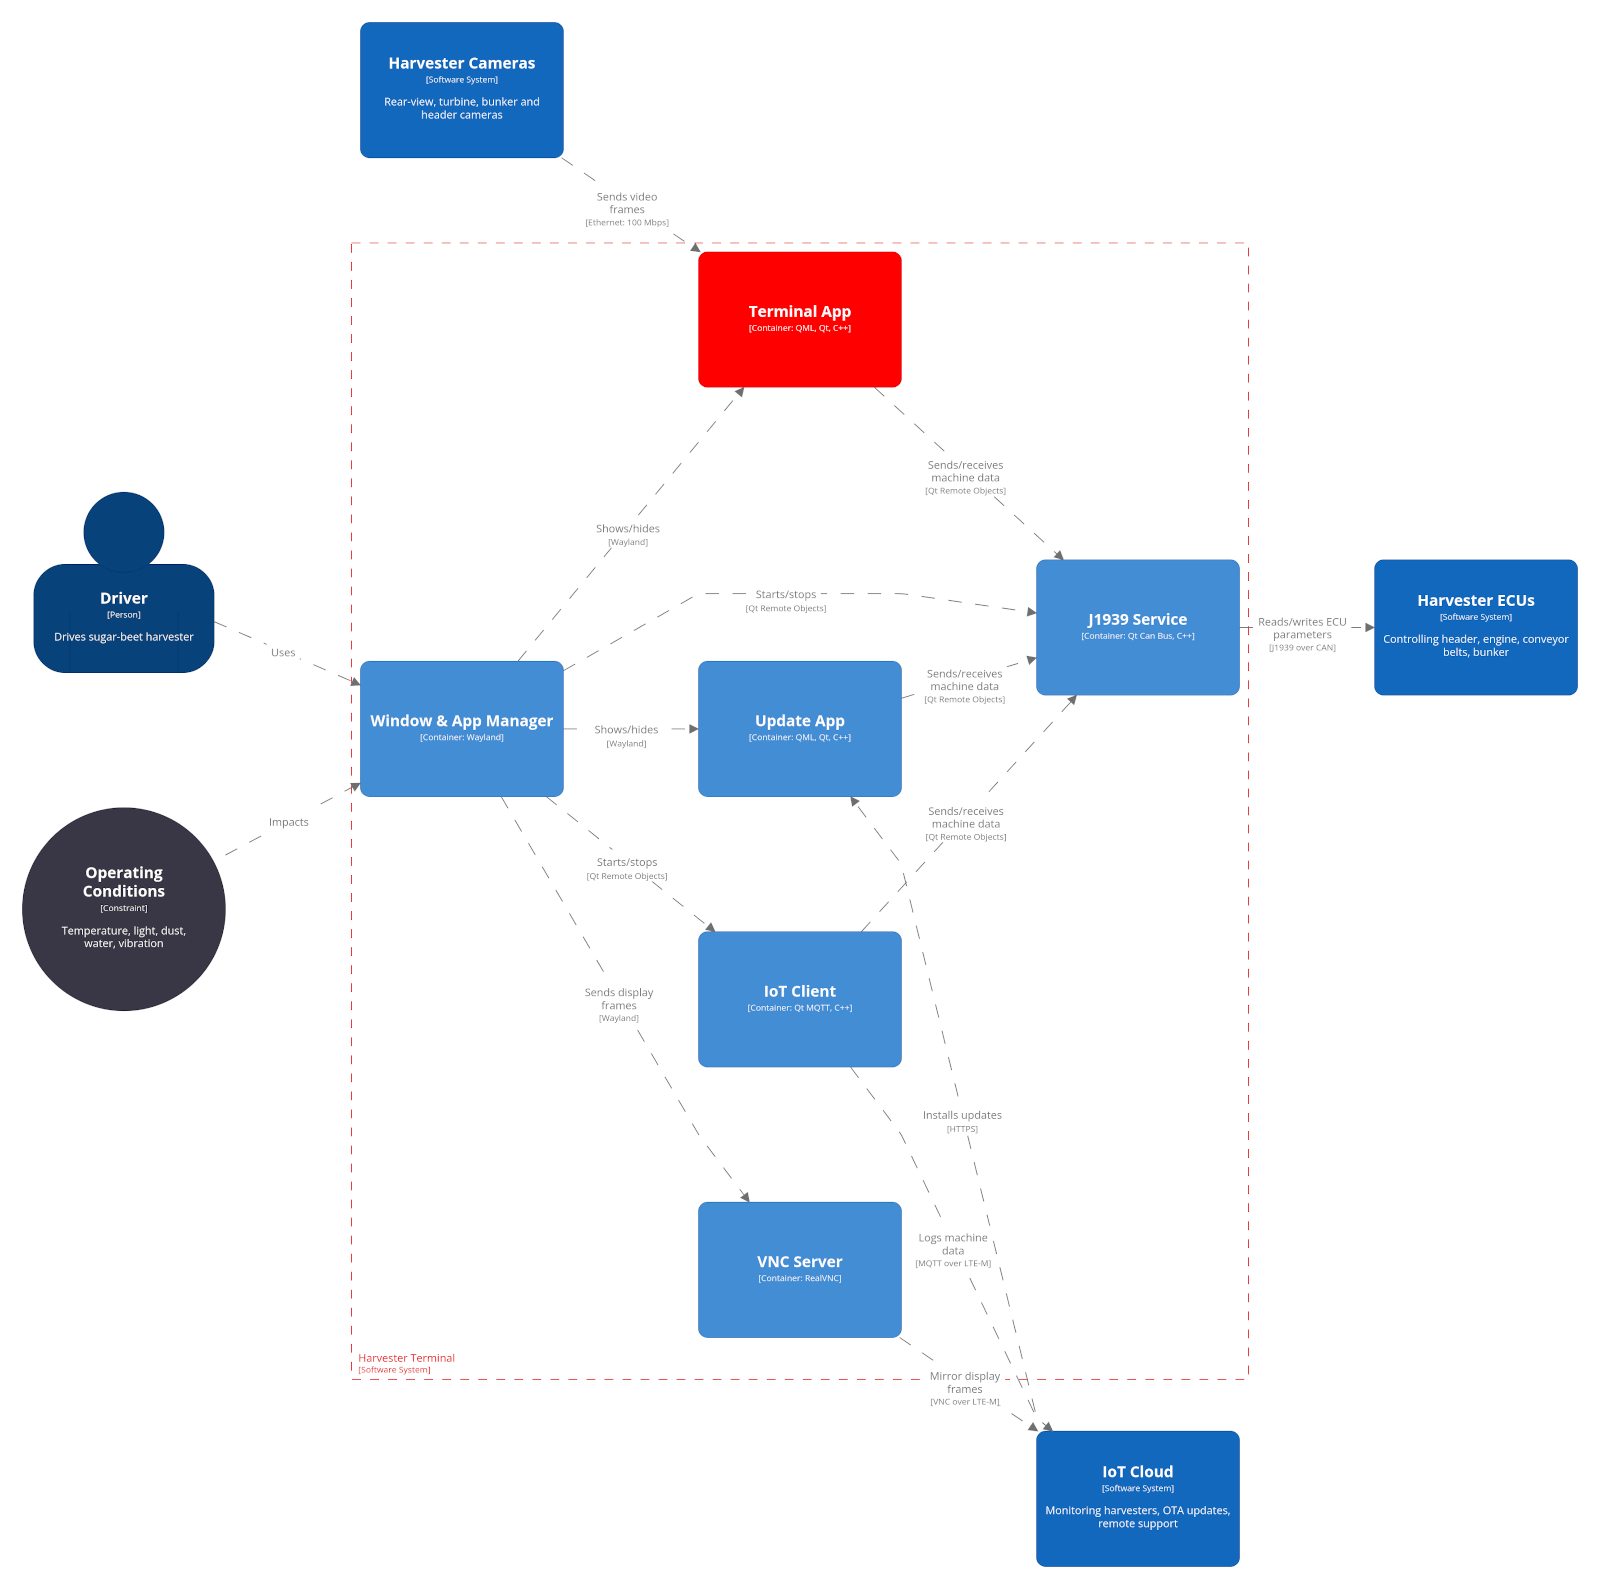
The Window & App Manager uses the Wayland protocol to show and hide the GUI applications (Terminal App and Update App). It also sends frames from the frame buffer to the VNC server, which mirrors them to the IoT Cloud for remote support. The GUI applications and services communicate with each other through Qt Remote Objects, which makes signals, slots and properties available for inter-process communication.
We could partition the Terminal Application into more GUI applications by its main responsibilities: Harvesting, Accounting, Customer, Camera, ECU Fine-Tuning, Diagnosis, Field Navigation, Calibration, Settings, Light and Climate Application. Drivers spend 90-95% of their time during the harvest in the Harvesting App. They need the other applications occasionally.
The partitioning leads to smaller applications with faster start-up times. It also makes the whole Terminal System more reliable. If one application has a bug, the other applications are not affected. This is paramount for the main Harvesting App, which should run without any problems through the 6-8 week harvest.
This fine-grained partitioning is shown in the next Container diagram. App 1…N stands for more GUI applications like Field Navigation, Settings, Light and Climate. We stick with the name Terminal App for the main Harvesting App in the diagram.

We started with a Terminal system implemented by a monolithic Terminal Application. As good architects, we would have structured the application as a modular monolith. The containers from the above diagram would be visible as components or modules, waiting to be turned into applications or services. The Component diagram of the monolithic Terminal App would look very similar to the Container diagram of the Terminal system above. Container and code diagrams will be part of the sequel post.
Drawing Diagrams with Structurizr
Up to now, I have drawn architecture diagrams with PowerPoint. This works reasonably well for small diagrams that never change like diagrams for posts or for talks. It gets cumbersome when we design an architecture for a legacy or new embedded system. Such diagrams change frequently – at least at the beginning. Designing with C4 diagrams has good tool support.
After a quick research, I chose Structurizr, which is developed by Simon Brown, the creator of C4 diagrams. I use Structurizr Lite, the free variant, for my first steps. Structurizr is a text-based modelling tool applying the model-view pattern to drawing diagrams. We enter the model as code written in a simple Domain Specific Language (DSL). We can define multiple views on the same model. The above context and container diagrams have a single model with four views. Brown calls it “diagram as code”.
I’ll explain how I created the above context and container diagrams in the remainder of this post. You find the example code for the diagrams in the base diagram directory docs/architecture/intro-c4-diagrams of the git repository eu-terminal-apps. Each subdirectory contains a file workspace.dsl describing the model and the views.
$ git clone git@github.com:bstubert/eu-terminal-apps.git
$ cd docs/architecture/intro-c4-diagrams

# Directory structure
c4-notation/
    workspace.dsl
getting-started/
    workspace.dsl
post-context-container-diagrams/
    workspace.dsl
...
Installing the Structurizr Container
Structurizr Lite is provided as a Docker container. We install Docker as described here for Ubuntu and for other Linux distros. The Structurizr container writes directories and files into the host file system (e.g., .structurizer/ and workspace.json) as root. We can change this behaviour by adding the option --userns-remap "<username>:<groupname>" to the ExecStart line in /lib/systemd/system/docker.service (see the post Docker userns-remap and system users on Linux for more details).
# Snippet of /lib/systemd/system/docker.service
ExecStart=/usr/bin/dockerd --userns-remap="<username>:<groupname>" -H fd:// --containerd=/run/containerd/containerd.sock
We replace the placeholders with the user and group name or the user and group ID as returned by the Linux command id. In my example, the output is
$ id
uid=1001(burkhard) gid=1001(burkhard) groups=1001(burkhard),...,998(docker)
We must change the line for the user name in /etc/subuid and the line for the group name in /etc/subgid as follows:
# /etc/subuid
<username>:<uid>:65536

# /etc/subgid
<groupname>:<gid>:65536
Finally, we reload the service definition and restart the Docker container.
$ sudo systemctl daemon-reload
$ sudo restart docker
This is a bit of work, but prevents the Structurizr container from cluttering our workspace with directories and files owned by root.
For convenience, we create a macro c4 for the longish Docker command.
$ alias c4='docker run -it --rm -p 8082:8080 -v $PWD:/usr/local/structurizr structurizr/lite'Getting Started
We change to the diagram directory getting-started/ and call the macro c4.
$ cd docs/architecture/intro-c4-diagrams/getting-started
$ c4
...
[INFO ] 2022-07-05 10:41:18.194 [main] Configuration -  Structurizr Lite
[INFO ] 2022-07-05 10:41:18.195 [main] Configuration -  Build: 2757
[INFO ] 2022-07-05 10:41:18.196 [main] Configuration -  Built: 2022-07-04T15:14:40Z
[INFO ] 2022-07-05 10:41:18.213 [main] Configuration -  Structurizr DSL: v1.20.0
[INFO ] 2022-07-05 10:41:18.213 [main] Configuration -
[INFO ] 2022-07-05 10:41:18.213 [main] Configuration -  Workspace path: /usr/local/structurizr
...
The Structurizr container is a web server creating a web application from the diagram specified in workspace.dsl. We can view the diagram in a web browser at the address http://localhost:8082/. When we open the diagram for the first time after starting the container, we must accept a EULA.

Here is the code for the context diagram.
# File intro-c4-diagrams/getting-started/workspace.dsl
workspace {
    model {
        terminal = softwareSystem "Harvester Terminal"
        driver = person "Driver"
        driver -> terminal "Uses"
    }

    views {
        systemContext terminal TerminalContext {
            include *
            autoLayout lr
        }
        theme default
    }
}
The model creates a software system with the name Harvester Terminal and assigns it to the variable terminal. It creates a person with the name Driver and assigns it to the variable driver. It defines a Uses relationship between the driver and the terminal: The driver uses the terminal. Context diagrams consist of software systems, persons and their relationships.
We define a system-context view for the software system terminal – the system in scope – with the identifier TerminalContext (one word, no spaces). The view includes the system in scope terminal and – by means of include * – all software systems and persons in direct relationship with terminal (here: driver). The view automatically lays out the elements from left to right (lr). Other layout directions are right-to-left (rl), top-to-bottom (tb, the default) and bottom-to-top (bt). The theme defines the element shapes, the background and text colour, the font size, and some other attributes.
Context Diagram for Harvester Terminal
We’ll extend the getting-started diagram (Figure 7) step by step into the context diagram for the harvester terminal (Figure 2). In Figure 2, both the terminal and the driver have a description: “Yield optimisation, customer accounting” and “Drives sugar-beet harvester”, respectively. As descriptions are optional, we add them in a block enclosed by curly braces. The opening brace must be on the same line as the definition of the context element.
# In model scope
terminal = softwareSystem "Harvester Terminal" {
    description "Yield optimisation, customer accounting"
}
driver = person "Driver" {
    description "Drives sugar-beet harvester"
}
We add the other software systems – IoT Cloud, Harvester ECUs and Harvester Cameras – and their relationships with Harvester Terminal in the same way as Harvester Terminal and Driver. We can add a technology like Ethernet: 100 Mbps to a relationship.
# In model scope
harvesterCams -> terminal "Sends video frames" "Ethernet: 100 Mbps"
For the Operating Conditions, we introduce a custom element called Constraint and add the relationship to terminal.
# In model scope
operatingConditions = element "Operating Conditions" "Constraint" {
    description "Temperature, light, dust, water, vibration"
}
operatingConditions -> terminal "Impacts"
The element Operating Conditions is shown as a rounded rectangle with light grey background and black text. Instead we want to style the element as a circle with dark grey background and white text.
# In views scope
styles {
    element "Constraint" {
        shape Circle
        background #393645
        color #ffffff
    }
}

# In model scope
operatingConditions = element "Operating Conditions" "Constraint" {
    tags "Constraint"
    description "Temperature, light, dust, water, vibration"
}
We tag the element operatingConditions with Constraint. We style every element tagged with Constraint as a circle with dark grey background and white text. Tags establish the connection between elements and styles. We tag terminal with Focus and set the background colour to red for the style Focus.
The diagram looks as in Figure 2. The positions of some elements may differ, because the layout seems to depend on the order in the diagram code. The code is in the file context-harvester-terminal/workspace.dsl.
Container Diagram with Single Custom Application
If you want to follow along, you start from the diagram context-harvester-terminal/workspace.dsl. If the Structurizr container is still running for another workspace.dsl file, say, the one for the getting-started diagram, we must stop the container, change into the directory context-harvester-terminal/ and start the container anew. If no container is running, the last two steps are enough. Stopping and starting the container is necessary, because the free Structurizr Lite supports only one workspace at a time.
# Finding Structurizr container, stopping it and starting it again
$ docker ps
CONTAINER ID        IMAGE               COMMAND
b1916d33ba0d        structurizr/lite    "catalina.sh run"
$ docker stop b1916d33ba0d
$ cd intro-c4-diagrams/context-harvester-terminal
$ c4
Our next goal is to extend the context diagram (Figure 2) into the container diagram with a single custom application (Figure 4). We move from the context level one level down to the container level. We decompose the Harvester Terminal system into two containers: the Window & App Manager and the Terminal App.
workspace {
    model {
        terminal = softwareSystem "Harvester Terminal" {
            tags "Focus"
            description "Yield optimisation, customer accounting"

            windowAppMgr = container "Window & App Manager" {
                technology "Wayland"
            }
            terminalApp = container "Terminal App" {
                technology "QML, Qt, C++"
            }
        }
        ...
        # After the context relationships
        windowAppMgr -> terminalApp "Shows/hides" "Wayland"
Inside the scope of the software system terminal, We create the container windowAppMgr with the name Window & App Manager and the technology Wayland. We could add a description for the containers as we did for the software systems. The relationship specifies that the windowAppMgr shows or hides the terminalApp using the Wayland protocol.
We introduce a container view for the software system terminal after the system-context view in the views scope. The view contains all containers from the terminal system and automatically lays out its elements from left to right.
# In views scope after systemContext
container terminal ContainerSingleApp {
    include *
    autoLayout lr
}
The container view shows the two applications and their relationship – without the system context.

We tag the software systems and persons with TerminalContext except for the terminal system.
# In model scope
driver = person "Driver" {
    tags "TerminalContext"
    description "Drives sugar-beet harvester"
}
iotCloud = softwareSystem "IoT Cloud" {
    tags "TerminalContext"
    description "Monitoring harvesters, OTA updates, remote support"
}
...
We add all elements tagged with TerminalContext to the container view with a second include statement.
# In views scope
container terminal ContainerSingleApp {
    include *
    include "element.tag==TerminalContext"
    autoLayout lr
}
Two or more include statements are combined as a logic OR. This is equivalent to the less readable one-liner.
include * "element.tag==TerminalContext"The diagram doesn’t show any any relationships between the elements of the TerminalContext and the two applications. We must add the relationships explicitly.
# In model scope
driver -> windowAppMgr "Uses"
operatingConditions -> windowAppMgr "Impacts"
harvesterCams -> terminalApp "Sends video frames" "Ethernet: 100 Mbps"
iotCloud -> terminalApp "Installs updates" "HTTPS"
terminalApp -> iotCloud "Logs machine data" "MQTT over LTE-M"
terminalApp -> harvesterEcus "Reads/writes ECU parameters" "J1939 over CAN"
We turn the background of terminalApp red by tagging it with Focus. The diagram looks like Figure 4. Its code is in the file container-single-app/workspace.dsl.
Container Diagram with Few Custom Applications
If you want to follow along, you start from the workspace container-single-app/workspace.dsl. You stop the Structurizr container, change to the workspace directory and start the container with the command c4.
We extract two containers – Update App and IoT Client – from Terminal App and introduce a new container VNC Server. Let us start with VNC Server. We add the VNC Server container and the relationships with Window & App Manager and IoT Cloud.
workspace {
    model {
        terminal = softwareSystem "Harvester Terminal" {
            ...
            terminalApp = container "Terminal App" { ... }
            vncServer = container "VNC Server" {
                technology "RealVNC"
            }
        }
        ...
        windowAppMgr -> vncServer "Sends display frames" "Wayland"
        vncServer -> iotCloud "Mirror display frames" "VNC over LTE-M"
    }
    ...
We introduce a new container view ContainerFewApps.
# In views scope
container terminal ContainerFewApps {
    include *
    include "element.tag==TerminalContext"
    autoLayout lr
}
As the view ContainerFewApps is defined in the same way as ContainerSingleApp, it is not surprising that the diagrams are the same as well. However, only the view ContainerFewApps should show the new container vncServer and not ContainerSingleApp. We tag terminalApp and windowAppMgr with SingleApp and include only the elements with the tag SingleApp in the view ContainerSingleApp.
# In scope of softwareSystem terminal
windowAppMgr = container "Window & App Manager" {
    tags "SingleApp"
    technology "Wayland"
}
terminalApp = container "Terminal App" {
    tags "Focus" "SingleApp"
    technology "QML, Qt, C++"
}

# In views scope
container terminal ContainerSingleApp {
    include "element.tag==SingleApp"
    include "element.tag==TerminalContext"
    autoLayout lr
}
Next, we add the container J1939 Service and its relationships.
# In scope of softwareSystem terminal
j1939Service = container "J1939 Service" {
    technology "Qt Can Bus, C++"
}

# In model scope
windowAppMgr -> j1939Service "Starts/stops" "Qt Remote Objects"
terminalApp -> j1939Service "Sends/receives machine data" "Qt Remote Objects"
j1939Service -> harvesterEcus "Reads/writes ECU parameters" "J1939 over CAN"
Figure 9 shows the problem. Terminal App can read and write ECU parameters directly from and to Harvester ECUs or indirectly through J1939 Service. The first path is a remainder from the system with a single custom application. The second path is what we want in a system with an extra J1939 Service.

The relationship between Terminal App and Harvester ECUs shall only be visible in the container view ContainerSingleApp but not in ContainerFewApps. We tag the relationship with SingleApp and exclude all relationships tagged SingleApp from ContainerFewApps.
# In model scope
terminalApp -> harvesterEcus "Reads/writes ECU parameters" "J1939 over CAN" {
   tags "SingleApp"
}

# In views scope
container terminal ContainerFewApps {
    include *
    include "element.tag==TerminalContext"
    exclude "relationship.tag==SingleApp"
    autoLayout lr
}
Adding the containers IoT Client and Update App works works in the same way as J1939 Service. The diagram ContainerFewApps looks as the diagram in Figure 5 – except possibly for a different layout. Its code is in the file container-few-apps/workspace.dsl.
Container Diagram with Many Custom Applications
The starting point for following along the transformation of Figure 5 to Figure 6 is the workspace container-few-apps/workspace.dsl. We copy the container view ContainerFewApps to the new view ContainerManyApps, tag all containers with FewApps and include only those elements tagged FewApp in ContainerFewApps.
# In scope of softwareSystem terminal
windowAppMgr = container "Window & App Manager" {
    tags "SingleApp" "FewApps"
    technology "Wayland"
}
terminalApp = container "Terminal App" {
    tags "Focus" "SingleApp" "FewApps"
    technology "QML, Qt, C++"
}
vncServer = container "VNC Server" {
    tags "FewApps"
    technology "RealVNC"
}
...

# In views scope
container terminal ContainerFewApps {
    include "element.tag==FewApps"
    include "element.tag==TerminalContext"
    exclude "relationship.tag==SingleApp"
    autoLayout lr
}

container terminal ContainerManyApps {
    include *
    include "element.tag==TerminalContext"
    exclude "relationship.tag==SingleApp"
    autoLayout lr
}
At this point, the two container views are the same. However, we can add containers to ContainerManyApps that are not contained in ContainerFewApps. We do this for the for the containers Diagnosis App, Calibration App and App 1…N and their relationships. Here is the code for App 1…N. The code for the other two containers is similar.
# In scope of softwareSystem terminal
moreApps = container "App 1...N" {
    technology "QML, Qt, C++"
}

# In model scope
windowAppMgr -> moreApps "Shows/hides" "Wayland"
moreApps -> j1939Service "Sends/receives machine data" "Qt Remote Objects"
As the last container, we add the Camera App. We replace the relationship harvesterCams -> terminalApp by harvesterCams -> cameraApp. We tag harvesterCams -> terminalApp with FewApps and exclude relationships tagged with FewApps from the view ContainerManyApps.
# In scope of softwareSystem terminal
cameraApp = container "Camera App" {
    technology "QML, Qt, C++"
}

# In model scope
harvesterCams -> terminalApp "Sends video frames" "Ethernet: 100 Mbps"{
   tags "FewApps"
}
windowAppMgr -> cameraApp "Shows/hides" "Wayland"
harvesterCams -> cameraApp "Sends video frames" "Ethernet: 100 Mbps"
cameraApp -> j1939Service "Sends/receives machine data" "Qt Remote Objects"

# In views scope
container terminal ContainerManyApps {
    include *
    include "element.tag==TerminalContext"
    exclude "relationship.tag==SingleApp"
    exclude "relationship.tag==FewApps"
    autoLayout lr
}
The two exclude statements are combined with a logical OR. They exclude all relationships that are tagged with SingleApp or that are tagged with FewApps or that are tagged with both. The two-line version is equivalent to the one-line version.
exclude "relationship.tag==SingleApp" "relationship.tag==FewApps"The diagram ContainerManyApps looks as the diagram in Figure 6 – except possibly for a different layout. Its code can be found in the file container-many-apps/workspace.dsl.
Which tool do you use to draw your diagrams?
Currently, I use Powerpoint. The C4 model website lists a couple of tools. I haven’t tried them yet.